Go Concurrency Series: Deep Dive into Go Scheduler(III)
Dive deep into the internals of Go Scheduler and strengthen your understanding by building a layer 7 load balancer.
In my previous posts in the Go Concurrency Series, I’ve gone into the different components of the Go Scheduler and covered how and why they are useful in making Golang highly effective for concurrent programming.
But, enough theory(at least for now ;)), let’s dive deep into seeing these behaviours in action!
Problem Statement
Let’s try to build a simple Layer 7 load balancer in Go. The setup is really simple, we’ll have a http server, which the backend services as well as the clients will connect to. The backend services on startup will connect to the load balancer and send periodic heartbeats, and whenever a client request comes, the load balancer will route it to a backend service based on the round-robin strategy! We’ll be simulating load on our load-balancer to see how the Go Scheduler behaves internally!
I’d appreciate if you did try on your own to do this as its really simple, but I’ve attached some references of code snippets for you.
Set-up
Server
Build a simple server using the “net/http” package, where the default route will be used for routing requests to downstream services. You can choose not to build the heartbeat tracking functionalities(if you want).
The only thing which I changed from the default settings is that I ramped up the maxDefaultConnectionsPerHost from 2 to 100. With a limit of 2, once both connections are in use, additional requests to the same host(downstream) must wait, leading to queueing and increased latency. Increasing the limit to 100 significantly reduces the chance of requests having to wait, thereby potentially decreasing response times. You can increase it further as well!
In addition to this, we’ll leverage pprof to understand what’s happening under the hood and hence please include the last snippet, which helps to start the profiling server on port 6060 and make sure that you’ve exposed this port through docker.
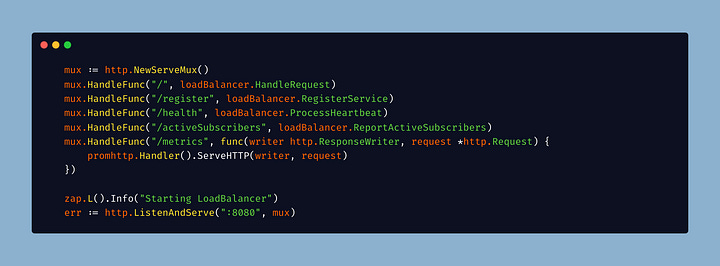
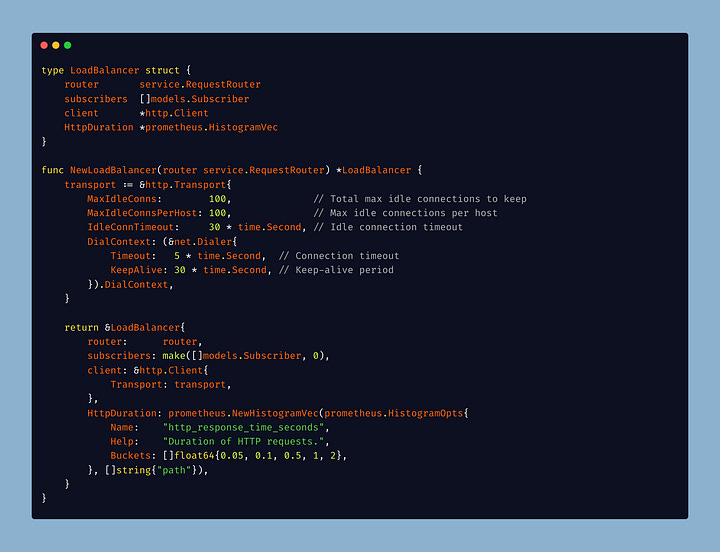
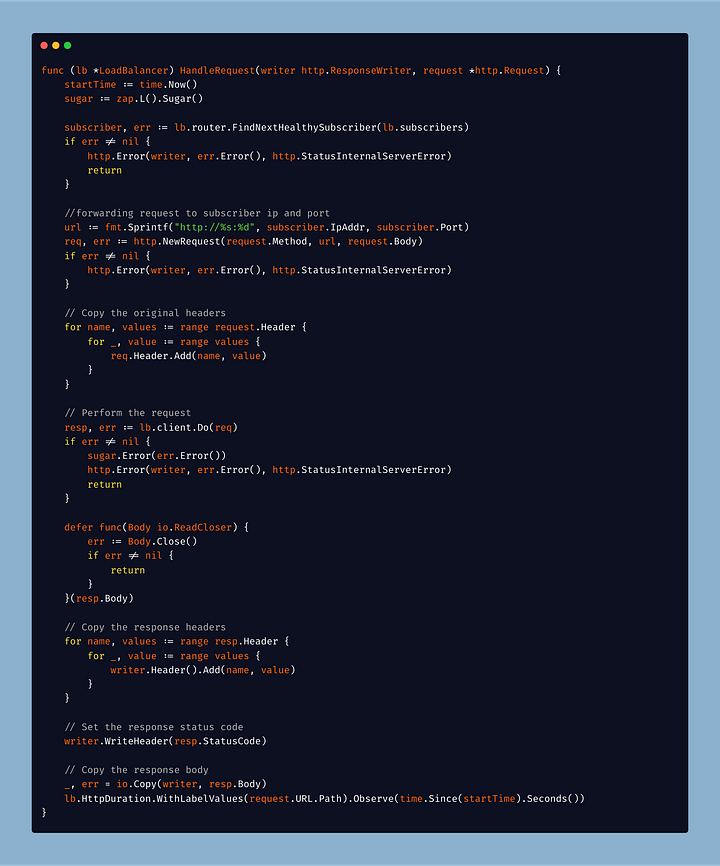
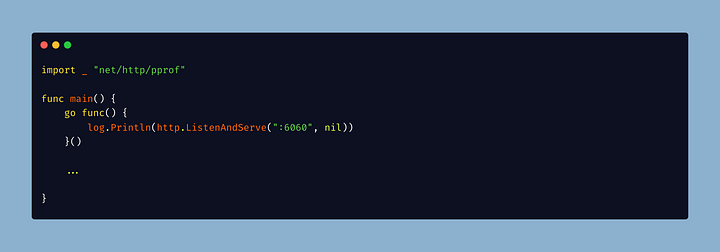
Downstream Service
Build a simple HTTP service, which just accepts incoming requests on the default endpoint and returns a string back to the load balancer. You should implement registering the service to the load balancer, so that the load balancer knows of the downstream service and is able to route requests to it.
Load Test
We use the “vegeta” library to simulate load. We start with 1000 requests per second and then we keep increasing to see the behaviour of the server and understand what’s happening under the hood. We do want to capture the results of the test and we print it out.
Docker Compose
We finally set up our docker compose, where we’ll set up our load balancer, downstream and load-test containers. I also have a prometheus container as I am capturing latency metrics but that’s optional for you.
Profiling
Let’s run the setup now using Docker Compose.
docker-compose up --build --scale downstream=3
So, we’re running 3 downstream containers, which will register to the LB and the load test will start running and sending requests to the load balancer which will route to the downstream clients.
How to view the profiler results?
Visit http://localhost:6060/debug/pprof/
OR
go tool pprof -http=:8085 http://localhost:6060/debug/pprof/<profile_name>
You’d notice that if you run the load test, and keep your RPS up and around 10K per second, Go is able to handle it(at least on my 10 core machine). So, I’ll let you play around with increasing the number of requests per second, and then checking the profiler/prometheus on the number of goroutines/threads created to handle the load.
You’d start noticing that as your increase the load, the goroutine count created by Go also increases. I’ve seen upto 40K goroutines created. But why?
Let’s dive into the why that is?
The “net/http” package ends up creating a new Goroutine for every incoming connection!! You can check the below snippet where I’ve extracted the code from the server.go file in the net/http library and you can see on the last line, that for every connection the listener accepts, there is a new goroutine created to handle that connection!
Because we’re constantly pumping 15K requests per second and for each request a new connection is being made by the load balancer to the downstream system, and for each connection the load balancer creates a new goroutine.
When a goroutine is created, it might be associated with a P, and executed on a thread M. Notice that the thread count is much lower(58) than the number of goroutines. Since, a network call is made, the goroutine will be parked and handed over to the network poller. The network poller will then monitor the network sockets, and when ready will notify the Go Scheduler. In the meantime, more goroutines are getting created and being put on the network poller’s queue.
Because of this, you could see the impact on latency, as you have some requests with latency higher than 2 seconds, with the p99 latency being about 47 seconds!
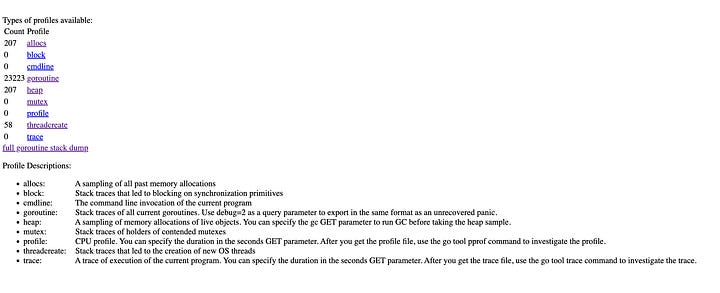
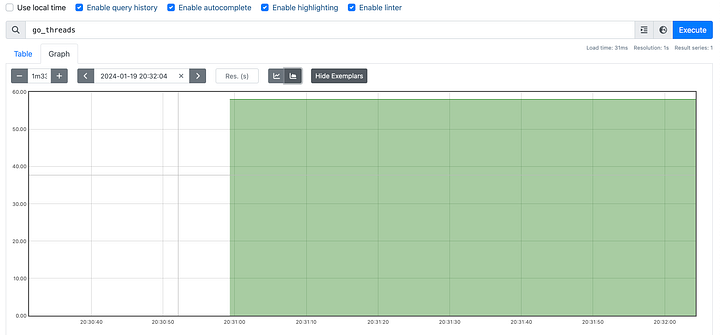
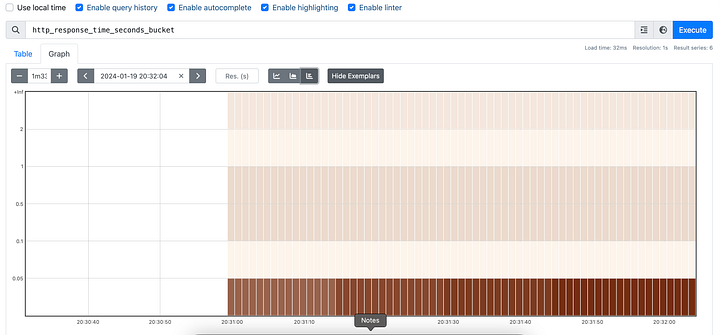
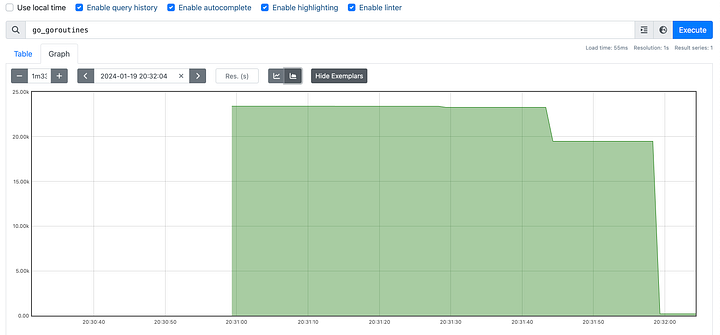
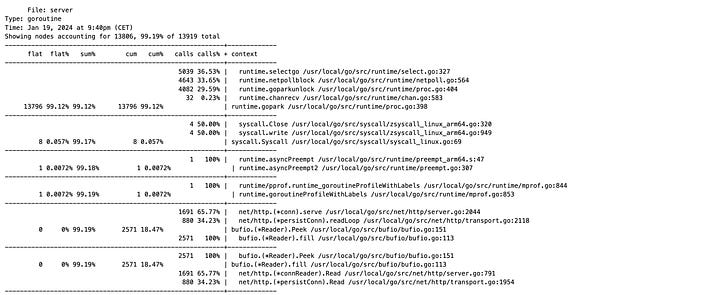
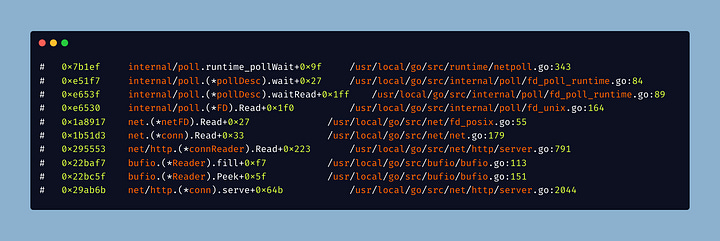
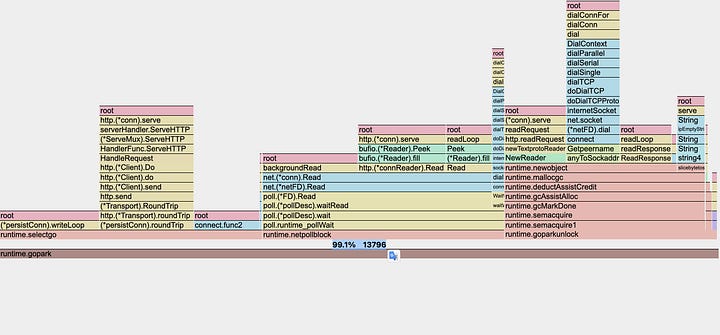
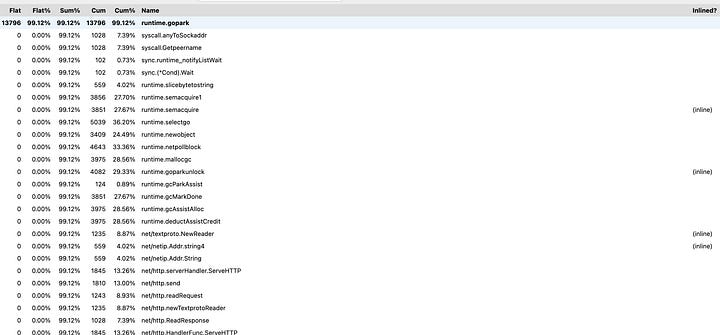
If we check the goroutine profiles in pprof, we see runtime.gopark is the most significant entry(check screenshot below), accounting for 99.12% of the activity. runtime.gopark is a function in the Go runtime that parks (suspends) a goroutine. A goroutine is parked when it is waiting for some event to occur and there is no useful work it can do.
If you now check the Stack trace attached, you’d notice that the goroutines are waiting for a file descriptor(network socket) to become ready for reading. And guess who is monitoring if the socket is ready? The Network Poller.
Want to dive a little more into what’s going on?
Let’s enable Scheduler Traces by setting the environment variable -
GODEBUG=schedtrace=5000
This will tell your program to emit a scheduler trace every 5 seconds.
Now let’s examine one of the traces -
SCHED 40110ms: gomaxprocs=4 idleprocs=0 threads=58 spinningthreads=1 needspinning=1 idlethreads=53 runqueue=2720 [1 106 125 129]
gomaxprocs: It shows that I’d limited the maximum number of operating system threads that can execute user-level Go code simultaneously to be 4.
idleprocs: Implies there are no idle P’s!
spinningthreads: As we discussed, we’ll always have at least one spinning thread!
needsspinning: Indicates that the scheduler needs more spinning threads because there might be runnable goroutines that aren't being serviced.
idlethreads: The number of threads that are currently idle and not executing any Go code.
runqueue: The number of goroutines that are in the global run queue waiting to be scheduled.
[1 106 125 129]: These are the sizes of the local run queues of the 4 P’s that we have!
A significant number of threads are idle (idlethreads=53), which might indicate that these threads were created in response to blocking operations, but now there's not enough work (or not enough P's available) to keep them all busy.
Hope you enjoyed this article! Do subscribe and share if you’ve been enjoying the Go Concurrency Series!


